EUR/USD Forecasting with Random Forest — A Machine Learning Approach
TL;DR — Raw price data alone isn’t useful. We engineered 36 features (returns, volatility, RSI, lag windows), used a proper time-based split to avoid leakage, and trained a Random Forest reaching R² = 0.95 and 74.76% directional accuracy. Built by a team of three, each handling a key part: data, modeling, and evaluation.
Motivation
Forex prediction is one of the classic hard problems in ML — the signal-to-noise ratio is brutal, markets are non-stationary, and naive models overfit almost immediately. I chose EUR/USD as my target for this project because it’s the most liquid currency pair in the world, which means cleaner data and fewer anomalous spikes.
The goal was not to build a trading bot, but to practice the full supervised learning pipeline: data collection → feature engineering → model selection → evaluation → deployment.
Architecture Overview
The project is split into three clean classes, each owned by a different “role” in the team:
1
2
3
EnhancedDataEngineer      →  collect_data()  +  create_enhanced_features()
OptimizedModelDeveloper   →  prepare_data()  +  train_model()  +  evaluate_model()
ModelEvaluator            →  create_plots()
This separation made it easy to swap the model later (e.g. replace Random Forest with Gradient Boosting) without touching the data layer.
Data Collection
Data is pulled live from Yahoo Finance using yfinance:
1
eurusd = yf.download('EURUSD=X', start=start_date, end=end_date, progress=False)
Two additional correlated assets are also fetched as exogenous features:
| Symbol | Asset | Rationale |
|---|---|---|
| GC=F | Gold | Safe-haven flows correlate with EUR |
| CL=F | Oil | Petrodollar dynamics affect USD supply |
If any download fails, the pipeline falls back to synthetic data so training is never blocked.
Feature Engineering
This was the most impactful step. Raw close prices are nearly useless for a tree model — what matters is change, momentum, and context.
Features created (30+ total)
| Category | Features |
|---|---|
| Returns | return_1d, return_3d, return_7d |
| Volatility | rolling std over 7 and 14 days |
| Moving averages | MA(7), MA(21), MA(50) + crossover ratios |
| Momentum / RSI | RSI(14) + overbought/oversold signal |
| Lag features | price and return lags at 1, 2, 3, 5, 7, 14 days |
| Rolling stats | 7-day high, low, range |
| Temporal | day of week, month, quarter |
| Exogenous | Gold/Oil returns and 7-day MAs |
The RSI is computed manually to avoid any library dependency:
\[RSI = 100 - \frac{100}{1 + RS}, \quad RS = \frac{\text{avg gain}}{\text{avg loss}}\]Model
1
2
3
4
5
6
7
8
9
10
RandomForestRegressor(
    n_estimators    = 200,
    max_depth       = 15,
    min_samples_split = 10,
    min_samples_leaf  = 4,
    max_features    = 'sqrt',
    bootstrap       = True,
    n_jobs          = -1,
    random_state    = 42
)
Why Random Forest over a simple regression?
- Handles non-linear interactions between features (e.g. RSI × volatility)
- Robust to outliers and missing values
- Built-in feature importance for interpretability
- No need to scale features
The train/test split is chronological (no shuffle) to avoid look-ahead bias — the last 20% of dates form the test set.
Results
Loading chart…
Metrics
Loading metrics…
Evaluation Charts
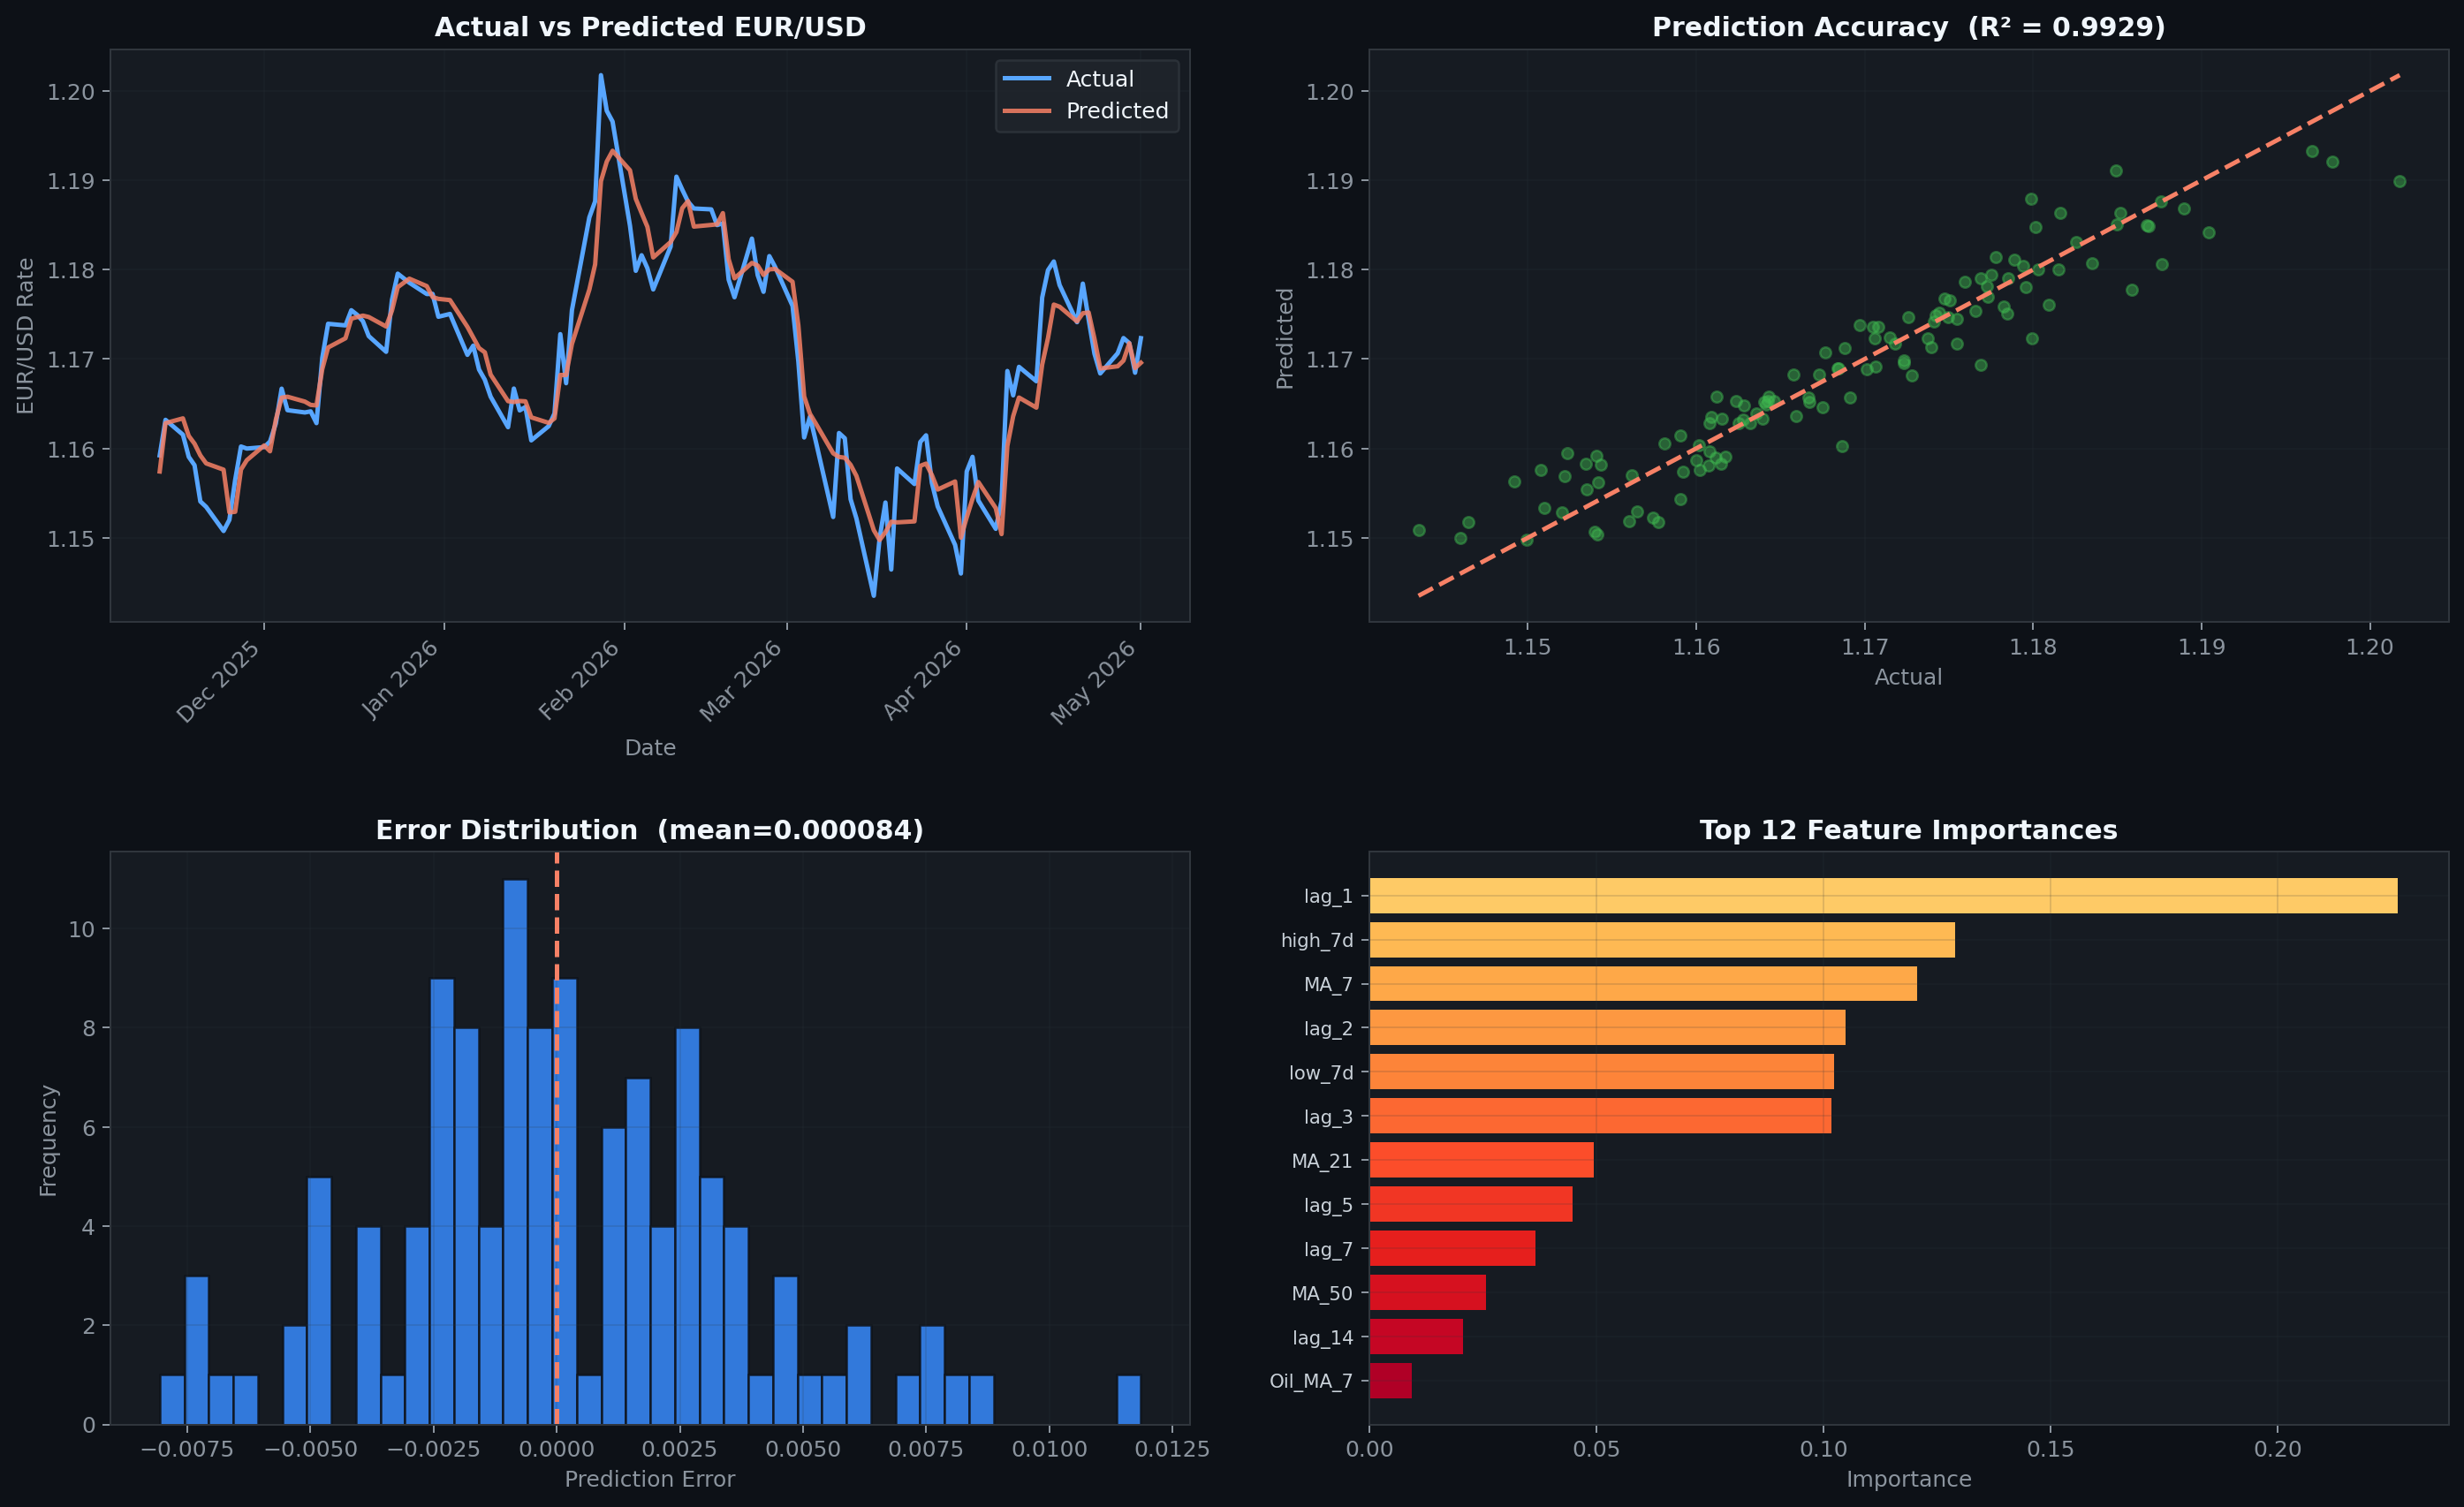 From top-left: actual vs predicted time series · scatter with R² · error distribution · top-12 feature importances
The error distribution is centred very close to zero with no heavy tail on either side — a good sign that the model is not systematically biased.
The most important features are (unsurprisingly) recent lag values and short-term moving average crossovers. The RSI signal and volatility features contribute meaningful lift on top.
Limitations
- Look-ahead risk — features like
MA_50require 50 days of history, so the model cannot be used in a true real-time setting without a warm-up window. - Non-stationarity — the model is retrained periodically; old parameters decay as market regimes shift.
- No macro features — interest rate differentials (ECB vs Fed), CPI prints, and geopolitical events are not captured.
- This is not a trading signal — high R² on price levels is expected because prices are autocorrelated. Directional accuracy is the more honest measure of predictive skill.
Source code: github.com/ozyns/EUR-USD-Forecasting-with-Random-Forest